04. Item-Level Statistics Visualization Component
This visual component aims to present usage statistics at the repository, national aggregator, and regional aggregator levels for an item based on its OAI identifier. It is centrally maintained in a CDN and can be embedded on the item page in repositories and portals. To install it, it is necessary to coordinate with the corresponding LA Referencia national node to ensure the presence of events.
- Installation documentation: https://github.com/lareferencia/lrw
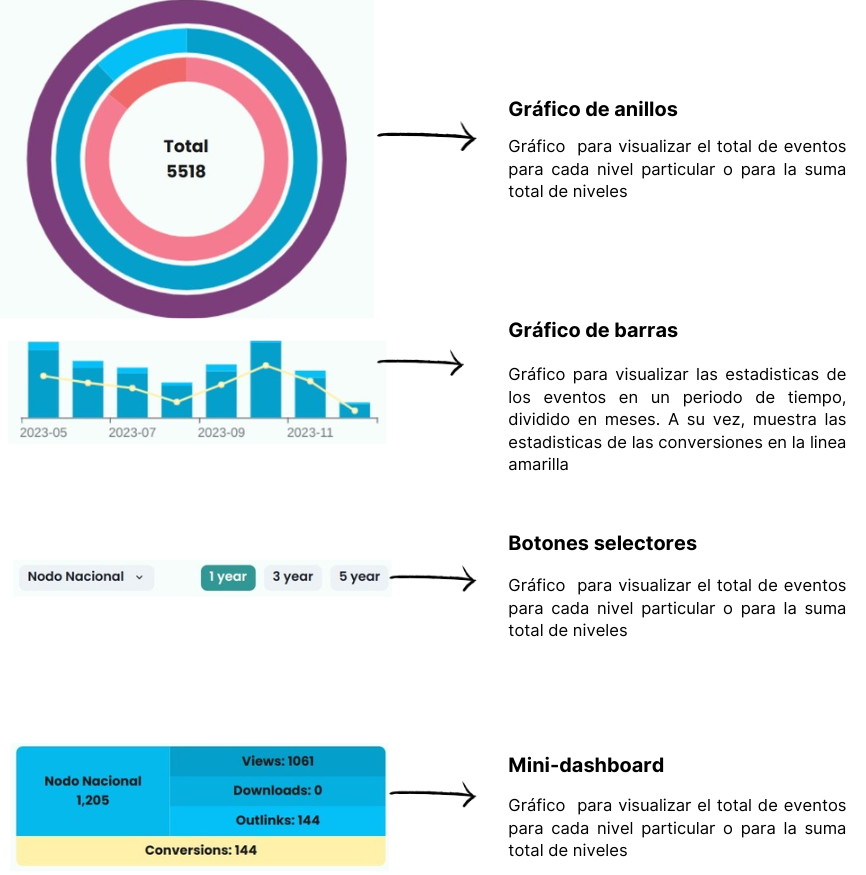
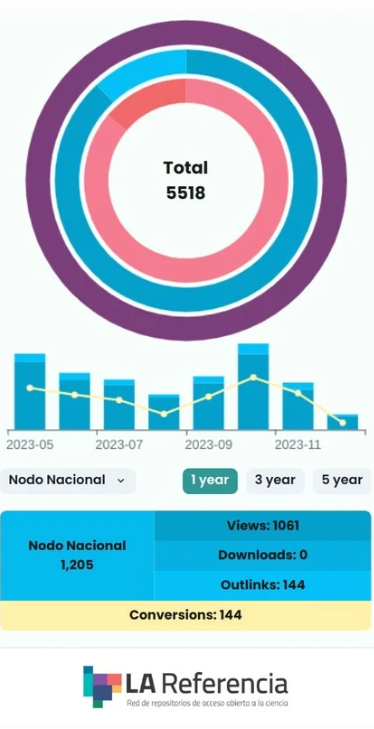
How to interpret the widget?
The widget consists of 3 main sections: a ring chart, a bar chart, and a mini-dashboard. All elements are interconnected and respond dynamically to level selectors and time-range buttons.